Velocity of Money-What is happening?
Vinish Shrestha
Introduction
This paper mainly deals with the velocity of money. The main purpose is determining what happens to the velocity of money when certain changes occur in economic variables. The variables of interest are the ones which are closely related to the velocity of money such as average money holding and consumer spending. Also, the paper takes other variables such as interest rate, inflation and CPI into account (mainly these will be used to perform required calculations). The paper is divided into two sections: the first section concentrates on the theory, whereas the second one focuses on the application of the theory.
First Section (Theory)
Velocity of money: 'The velocity of money is number of times per unit of time; such as a year, the typical piece of money turns over' (Robert J. Barro, 106). Informally, one can suggest that the velocity of money is the rate of spending money. Assuming a simple economy comprising of person A and person B; if the average holding of money between them is $5 a month and if they spend $50 a month, then the velocity of money is 10.
Average money holding in a period (ũ)=(Pc.T)/2 where T is the length of the period in terms of the year when the next withdrawal is made, and Pc is the total consumption in a year . In the real term, average money holding can be written as-cT/2.
Thus, the velocity of money can be written as:
Velocity=Pc/ ũ (the ratio of total spending and average money holding, where Pc is the total spending in a year). Dividing the nominal velocity of money by the price index, I can say that the real velocity of money is-2(1/T). Hence, in real terms the velocity of money is inversely related to the time interval, T.
After knowing that the real velocity depends on the time interval, it is important to find out how the rational person chooses the time interval, T. T is chosen in a way such that it minimizes the total real cost of 'cash management ' (Barro, 100). For instance, in a very simplistic model, cash management involves two costs-transaction cost and interest forgone cost. There happens to be an inverse relationship between the transaction cost and the time interval T. The logic here is straightforward-as the time interval increases the transaction cost decreases and vice versa. For instance, a person who goes to the bank once a day will bear more transaction costs than that who goes to the bank once a week. On the other hand, interest-forgone cost is directly related to the time interval. This states that if the time interval is huge then a person has to get sufficient money from the bank, so that he/she fulfills his/her consumption for the particular period. Thus, he/she will be losing or forgoing interest which he could have earned by maintaining a shorter time interval.
Transaction costs and interest forgone costs can be written as below:
Transaction cost= (ζ/P). (1/T) {Where (ζ /P) represents the real cost per transaction}
Interest-forgone =R. cT/2 {Where R stands for the annual interest rate}
Minimization of the Total Cost of Cash Management
Mathematically, total cost of cash management can be written as,
f(T)= (ζ/P). (1/T) + R. cT/2 equation 1
{where f is a function which assigns to each positive T, some other f(T)} Note that T >0, in all cases. Taking the derivative of f(T) gives marginal cost which can be mathematically written as,
f'(T)= df(T)/dT= d {(ζ/P). (1/T)}/dT + R. c. d (T/2)/dT equation 2
0= d {(ζ/P). (1/T)}/dT + R. c. d (T/2)/dT equation 3
Equation 3 gives the values of T such that it either minimizes or maximizes f(T). In order to find out the value of T, such that equation 1 is minimized, the concept of double derivative should be applied.
f'(T)=d { d f(T)/ dT}/ dT {Where f'(T) represents the double derivative of f(T)} equation 4
Now, if the value of T, which was discovered from equation 3 engenders f'(T) such that it is greater than 0, then that particular T minimizes the total cost of cash management. Hence, the rational person aims for selecting this T, in order to minimize the cost of cash management.
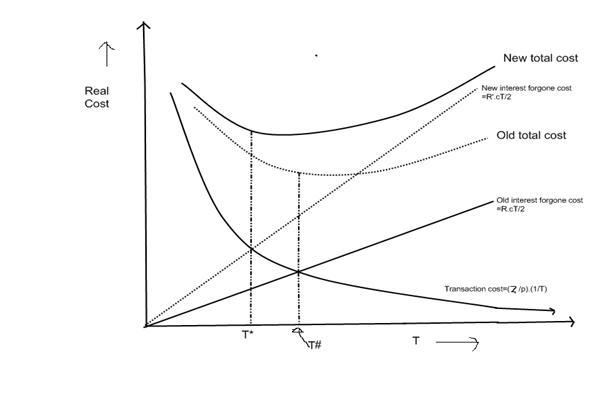
The behavior of the transaction cost, interest forgone cost and the total cost can be illustrated by the graph drawn below. Let us assume that T# is the number that minimizes the value of f(T) in equation 1.
Thus, from the graph, one can see that the rational person attempts to choose T# such that it minimizes the total cost. As T approaches infinity, the transaction cost approaches 0. But the result seems to be directly related in the case of interest forgone. Furthermore, rise in R will move the interest forgone line towards the left because people react to the change by shortening the time interval T. In other words, people become more concerned about the interest forgone cost than the transaction cost. Also, the total cost minimization happens at T*, which is noticeably less than T#.
Finally, one can come up with a theoretical conclusion-the rise in interest rate will make people decrease their time interval, thus increasing the frequency of exchange. As velocity of money is inversely related to the time interval or is directly related to the frequency of exchange, as interest rates rise, the velocity of money increases. Also, it is logical, because as the interest rate rises, rather than holding money people will try gaining advantages from the high interest rate. Hence, the reduction in average holding of money causes the velocity of money to rise.
After reaching this conclusion, the rest of the paper concentrates in analyzing the trend of the velocity of money from 1959 to 2008; and it will be related with the interest rate of the respective years.
To calculate the velocity of money, I used the historical data of personal consumption, frankly, to keep the model simple. M1 was used to calculate the average holding of money. All of the numbers were converted to the real terms and were tied to the 2008 dollars. The annual federal funds rate was used to analyze the relationship between the interest rate and the velocity of money. The annual federal funds rates were obtained online and no changes were made to them. Also, the correlation between the federal funds rate and average money holding (average of M1) from 1959-2008 was calculated to be -0.4853. Even though the correlation coefficient is not strong, it justifies the claim that the interest rate and money holding are inversely related. Moreover, the correlation coefficient of personal consumption and velocity of money from 1959-2008 is approximately 0.957. From the calculated coefficient, it is obvious that the velocity of money and personal consumption are very strongly related.
Section 2 (Applied)
Analyzing the Graphs
There are some interesting conclusions which can be drawn out from the graphs. As one can see, even though there have been minor fluctuations here and there, the overall graph of the velocity of money seems to have an upward trend. By consulting the simple model of the velocity of money which was discussed in the theoretical section of the paper, one can see that for the velocity of money to have an upward trend either personal consumption should increase or money holding should decrease. Analyzing the trend of the velocity of money would be much simpler if the graph is divided into two separate time frames {(1959-1990) and (1991-2008)}.
Graph 1. This is the graph of the velocity of money v/s the time line. Time line is listed on the horizontal axis and velocity is on the vertical axis.
Graph2. This is the graph of the annual nominal federal funds rate. FFR is on the vertical axis in % and time frame is on the horizontal axis.
Graph 3. This is the graph of the real federal funds rate. The real federal funds rate is on the vertical axis in % and time frame is on the horizontal axis.
Graph 4. This graph is of real personal consumption tied to 2008 dollars (in billions). Real Personal Consumption tied to 2008 dollars is on the vertical axis and Time frame is on the horizontal axis.
(1959-1990)
It is obvious from the graph that the velocity of money increased over these years. This can be majorly related to one very important fact-the rise in interest rate. The nominal federal funds rate started rising from 1945 to 1980. The condition with the real federal funds rate was more dramatic because it hit the negative values two times before 1980, but still the overall trend was increasing. As one can see, the velocity of money reached its peak in the early 1980s, and the curve more or less had a uniform motion from 1980-1985. The nominal and the real federal funds rate peaked in the year 1981, and had the values 16.39% and 6.09% respectively. The interest rate seems to have a declining trend after the early 80s. Hence, during the early 80s, increment in federal fund rate caused people to lower their average money holding (M1). This resulted in high velocity of money. But as the federal funds rate started to decline after the early 80s, the velocity of money started to fall. Moreover, over the years 1959-1990, the correlation coefficient of the velocity of money and the real federal funds rate takes the value 0.375, which explains the direct relationship between the velocity of money and the interest rate, even though the relation is not that strong.
Also, one needs to take into account the fact that the velocity of money not only depends on the interest rate, but is also very much influenced by personal consumption. In other words, it holds true that the velocity of money could decline even during a period when the interest rate is rising. Basically, if the rise in interest rate reduces the real money balance relative to the volume of personal consumption (spending), then the velocity increases (Barro, 108). But if the personal consumption decreases proportionally more than the reduction of the real money balance, then the velocity of money decreases.
For simplicity let's assume that the personal spending during the year 1 was $10 and the average money holding was $5. Now, the velocity of money would be 2. Then let's say that the personal spending fell to $7 in the year 2 and money holding fell to $4. Now the velocity for year 2 would be 1.75, which is clearly lower than that of the first year. Also, it is true that even though the interest rate decreases, the velocity of money could increase, if personal spending increases proportionally more than the increment of money holdings. Moreover, this exact thing seems to have happened after the year 2000, which I will be discussing in the following section.
(1990-2008)
I would like to start this section by mentioning that the correlation coefficient of the real federal funds rate and the velocity held the value -0.31795 (from the years 1990-2008). On first glance, this of course states that there is a negative relationship between the real federal funds rate and the velocity of money. But does the preceding sentence speak the truth? In order to find an answer for this, we have to determine the relationship between the real federal funds rate and the money holdings (M1). If the correlation between the money holding and the federal funds rate is positive, then one could state that there happened to be a negative relationship between the velocity of money and the federal funds rate over the years 1990-2008. But the correlation coefficient of money holdings and the interest rate is -0.19; this clearly states that even after the year 1990, real money holdings and the interest rate happened to be negatively related, which agrees with the theoretical section of this paper.
To resolve why there happened to be a negative correlation between the real federal funds rate and the velocity of money, it is important to trace what really happened after 1990. From the graph, it is true that the real federal funds rate started to decline after the late 80s, and it kept on declining until 1993, when the rate was 0.02 %. Also, it is explicit that the velocity started declining and reached the lowest point of 4.14 in the year 1994. The real federal fund rate increased dramatically from 1993 to 1995, and this was followed by an increasing trend of the velocity of money. After 1999 the real federal funds rate started declining, but the velocity of money moved in the opposite direction. According to the theory, the fall of the real federal funds rate should have inspired people to hold more money and the increment of money holding should have pushed the velocity of money down. But this is not what happened. It is because, even though the lower rates influenced people to hold more money, the personal consumption was much higher than the proportion of money being held. Moreover, the high personal consumption dominated the increase in the money holding; this resulted in an increment of the velocity of money.
Conclusion
This paper dealt with simplistic, but also at the same time, extremely important material. I carefully analyzed the trend of the velocity of money of the U.S., and I tried finding the relation between the velocity of money, interest rate and personal consumption. In the process of doing so, I collected the historical data of personal consumption, annual nominal federal funds rate, money holding (M1), inflation rate, and CPI from the Federal Reserve's website. Also, the desired data such as the real federal fund rate, real M1 tied to 2008 dollars and real personal consumption were computed by me.
References
Barro, Robert J. Macroeconomics. John Wiley & Sons, 1983. Print
Bureau of Economic Analysis. Gross Domestic Product. Web. 28 February 2009.
Federal Reserve Statistical Release. Money Stock Measures. Web. 24 February 2009.
Federal Reserve Statistical Release. Selected Interest Rates. Web. 28 February 2009.
InflationData.com. Historical US Inflation rate 1914-Present. Web. 28 February 2009.
U.S. Department of Labor: Bureau of Labor Statistics. Consumer Price Index For All Urban Consumers: All Item. February 20 2009. Web. 28 February 2009
©