The Comparison of Vitamin C Content in Commercially Available Sources of Orange Juice Using HPLC
Leslie Gummersheimer
Abstract
The present work utilized high performance liquid chromatography (HPLC) method for determining vitamin C content of commercially available orange juices by comparing juices in carton, plastic jug, and frozen containers, as well as a fresh orange. HPLC allows an efficient and quick way to relatively quantify vitamin C with a low cost of equipment and reagents. The results indicated higher daily percents of vitamin C than those provided on the container�s label. The fresh sample yielded the largest amount of vitamin C per serving, followed by the frozen sample, the carton sample, and then the plastic jug sample.
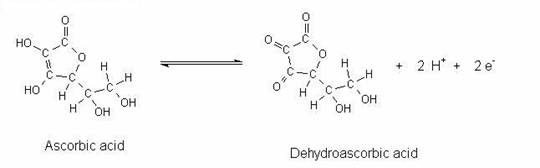
The purpose of this experiment was to compare the vitamin C concentrations of carton, plastic bottled, frozen and freshly squeezed natural and commercially available orange juice samples. There has been a great amount of studies on vitamin C because it is considered to play crucial roles in human health. Certain quantities of ascorbic acid are required by the immune system for healing the body, metabolizing carbohydrates, and resisting infections (Gritsanapun et al., 2002). Ascorbic acid, commonly known as Vitamin C, is a water-soluble vitamin that is present in fruits, especially citrus fruits. Unfortunately, Vitamin C cannot be synthesized by the human body and must be consumed regularly. Also, ascorbic acid in vitamin C is not stable in air and undergoes an oxidation reaction with atmospheric oxygen. Ascorbic acid of fruit juices is readily oxidized with shelf time at rates depending on the conditions of storage (Collins et al., 1999). Dehydroascorbic acid is the oxidized form of vitamin C. (See Figure 1). Some methods measure deyhroascorbic acid (C6H6O6) and ascorbic acid (C6H8O6) together to give the total amount of Vitamin C (Boostani et al., 2004). For example, an analysis method such as HPLC simultaneously evaluates ascorbic acid and dehydroascorbic acid since their structures are almost identical (Lagier and Verdini, 2000). Therefore, in this experiment, the amount of vitamin C was determined as the sum of ascorbic and dehydroascorbic acids. However, it is reported that the average amount of dehydroascorbic acid in commercial orange juice ranges from 0 to 0.2%. Since this is such a small amount, it can be considered negligible (Kabasakalis et al., 2000).
Air-Oxidation of Ascorbic Acid
This study tested different types of commercially available natural orange juice samples to compare the amount of vitamin C in each type of container. The purpose was to see if the container type affected the vitamin C levels with the orange juice. The only variable in the samples used was the container that the samples were stored in.
Many different methods can be used to determine the vitamin C content in juices. Spectrophotometry, chemiluminescence, amperometry, potentiometry, and high performance liquid chromatography have been utilized as detection techniques (Reis and Paim, 2000). High performance liquid chromatography (HPLC) was the instrument used for this experimentation because it is highly precise and accurate (Lagier and Verdini, 2000). The amount of vitamin C present was determined by using the HPLC method to compare the different container types.
High Performance Liquid Chromatography (HPLC):
Using a BLC-20 HPLC with UV detection at 210 nm completed the determination of vitamin C concentration. A 5m, 150x4.6mm column, a 50mL loop and a flow rate of 1 mL/min were utilized. The retention time of ascorbic acid was 3.3 minutes. The mobile phase, 25mM KH2PO4 at a pH of 2.5, was degassed.
Standard Solution Preparation:
The standard ascorbic acid solutions were prepared dissolving the ACS reagent (Sigma Chemical Co.) in distilled and boiled water. The water was boiled to remove oxygen to minimize oxidation of ascorbic acid. Extremely purified standard solutions were prepared immediately before use. The concentration values of 0.035mg/mL through 0.176mg/mL ascorbic acid were used, and two samples of each value were ran to find an average peak of the two runs.
Sample Preparation:
HPLC analysis was carried out on samples of freshly squeezed, frozen, carton and plastic bottled orange juices. The brand chosen for use was Minute Maid orange juice because it does not contain any added preservatives or sweeteners, and had not been fortified with Vitamin C, which are important requirements for this project. All of the orange juice samples were tested before the expiration date. The samples were diluted 1:5 using deionized and boiled water. The samples were filtered to remove particles in the suspension that result from the homogenization of vitamin C with a 0.45m pore size filter first and with a 0.2 m pore size filter again before being injected into the HPLC system. Since this step may cause slight oxidation of ascorbic acid, the method was completed as quickly as possible to prevent air-oxidation of ascorbic acid. The fresh orange sample was peeled, blended, and then filtered through cheesecloth and glass wool before being diluted and filtered as the other samples were.
|
Sample (M) |
mg/mL |
Retention time (min)* |
Peak Area* |
Peak Height* |
|
2.0x10⁻⁴ |
0.035 |
3.50 |
208 |
17 |
|
3.0x10⁻⁴ |
0.053 |
3.50 |
292 |
24 |
|
4.0x10⁻⁴ |
0.070 |
3.48 |
388 |
33 |
|
5.0x10⁻⁴ |
0.088 |
3.56 |
464 |
38 |
|
6.00x10⁻⁴ |
0.106 |
3.58 |
535 |
44 |
|
7.00x10⁻⁴ |
0.123 |
3.55 |
622 |
51 |
|
8.00x10⁻⁴ |
0.141 |
3.56 |
696 |
57 |
|
9.00x10⁻⁴ |
0.159 |
3.55 |
787 |
65 |
|
1.00x10⁻³ |
0.176 |
3.47 |
920 |
78 |
*Each standard sample was ran twice, the value reported above is the average of the two.
Figure 1
Chromatogram of Standard Sample of Ascorbic Acid (9x10⁻⁴M)
Figure 2
*The plastic jug, frozen, and fresh samples all had identical chromatograms to Figure 2.
*Other peaks: Glutamic, Oxalic, Tartaric, and Malic Acids.
Table 2
|
Sample |
Retention time (min) |
Peak Area |
Peak Height |
|
A |
3.22 |
487 |
33 |
|
B |
3.20 |
482 |
32 |
|
C |
3.18 |
585 |
37 |
|
D |
3.17 |
463 |
32 |
|
E |
3.17 |
587 |
38 |
|
F |
3.15 |
574 |
33 |
|
Average |
3.18 |
530 |
34 |
|
Sample |
Retention time (min) |
Peak Area |
Peak Height |
|
A |
3.33 |
468 |
32 |
|
B |
3.32 |
417 |
30 |
|
C |
3.32 |
493 |
33 |
|
D |
3.30 |
498 |
34 |
|
E |
3.30 |
405 |
30 |
|
F |
3.27 |
476 |
33 |
|
Average |
3.31 |
460 |
32 |
Table 4
|
Sample |
Retention time (min) |
Peak Area |
Peak Height |
|
A |
3.30 |
597 |
41 |
|
B |
3.28 |
613 |
40 |
|
C |
3.27 |
575 |
41 |
|
D |
3.25 |
584 |
38 |
|
E |
3.23 |
671 |
43 |
|
F |
3.25 |
665 |
44 |
|
Average |
3.26 |
618 |
41 |
Table 5
|
Sample |
Retention time (min) |
Peak Area |
Peak Height |
|
A |
3.22 |
765 |
49 |
|
B |
3.22 |
655 |
45 |
|
C |
3.20 |
666 |
46 |
|
D |
3.20 |
801 |
47 |
|
E |
3.20 |
821 |
51 |
|
F |
3.18 |
796 |
50 |
|
Average |
3.20 |
751 |
48 |
|
Sample |
Average Retention Time (min) |
Average Peak Area |
Average Peak Height |
|
Carton |
3.18 |
530 |
34 |
|
Plastic |
3.31 |
460 |
32 |
|
Frozen |
3.26 |
618 |
41 |
|
Fresh |
3.20 |
751 |
48 |
The comparison of the orange juice containers is represented below in Table 7, which contains the mg/serving values of vitamin C for each sample.
Table 7
mg/serving size Values of Vitamin C
Sample |
mg/Serving of Orange Juice |
Percent Daily Requirement of Vitamin C In One Serving |
|
Carton |
123 |
206% |
|
Plastic |
106 |
177% |
|
Frozen |
145 |
241% |
|
Fresh |
177 |
295% |
*Commercial serving size for orange juice is 240mL. 60mg of ascorbic acid corresponds to 100%.
Comparison of the average vitamin C contents of each sample type can be compared to the percent daily requirement that was listed on the package label. There is a large difference between the two values.
Table 8
Calculated Percent Daily Requirements of Vitamin C Compared to the Percent Daily Requirement of Vitamin C on the Package Label
Sample |
Experimental Percent Daily Requirement of Vitamin C In One Serving |
Percent Daily Requirement of Vitamin C Listed on the Package Label |
|
Carton |
206% |
120% |
|
Plastic |
177% |
130% |
|
Frozen |
241% |
160% |
|
Fresh |
295% |
N/A |
**The percent daily requirements were calculated by using the values in the Table 9.
By observing Table 7 and Table 8, it can be determined that the fresh orange juice sample contains the largest amount of vitamin C, followed by the frozen sample, the carton sample, and then the plastic jug sample. These values can be compared to the values that are used on food and dietary supplement labels to indicate the percent of the recommended daily amount of each nutrient that a serving provides. The recommended daily intakes for Vitamin C are listed in Table 9.
Table 9
|
Persons |
U.S. (mg) |
|
Infants and children
|
30�40 |
|
4 to 6 years of age |
45 |
|
7 to 10 years of age |
45 |
|
Adolescent and adult males |
50�60 |
|
Adolescent and adult females |
50�60 |
|
Pregnant females |
70 |
|
Breast-feeding females |
90�95 |
|
Smokers |
100 |
*This information was located on the website: http://www.mayoclinic.com/health/drug-information/DR202071
Comparison of % Daily Values
Graph 2 expresses the normal percent daily amounts in comparison to what the label of the orange juice claimed, as well as the experimentally determined percent daily requirement. The experimentally determined percent daily value in one serving showed to be considerably larger than the daily percent listed on the orange juice label. The difference in the two percent daily values for the three samples; carton, frozen, and plastic, were 86%, 81%, and 47%, respectively. Both values of daily percent are very large in comparison to the normal daily percent value. The percent daily requirement listed on the orange juice label may have been significantly lower than the experimentally determined. Therefore, a significant amount of error must have occurred within the HPLC because the peak areas were not consistent with the standard curve. The samples had a larger peak than the standard samples. This may have been caused by the standard samples not being run on the same day as the orange juice samples. Another error that may have occurred would have been the timing of the samples ran after the container of orange juice was opened. If there was not a consistent time period from when the container was opened and the samples were ran for each type of sample, than the results may have been affected. The greatest amount of error can be observed by comparing the average retention time of the standard samples (3.53 minutes) to the average retention time of each sample container type, frozen (3.26 minutes), carton (3.18 minutes), and plastic (3.31 minutes), respectively. The retention times of the orange juice samples had shifted significantly lower than the average retention time of the standard samples. This shift may be due to the presence of the other organic acids within the orange juice. The ascorbic acid peak on the chromatogram contains contributions from the peaks of the other organic acids present. The greater the contribution of the other acids equals the greater the decrease in the retention time. The greater the shift in the retention time equals the larger percent error within the calculated percent daily ascorbic acid per serving.
|
Sample |
Retention Time (min) |
Shift in Retention Time (min) |
Difference in two %�s |
|
Carton |
3.18 |
0.35 |
86% |
|
Plastic |
3.31 |
0.22 |
47% |
|
Frozen |
3.26 |
0.22 |
81% |
|
Fresh |
3.20 |
0.33 |
N/A |
*The average retention time of the standard samples was 3.5 minutes.
From Table 10, it can be observed that the carton sample had the greatest shift in retention time, as well as the greatest difference in the two percents. This direct correlation is relevant to the plastic and frozen samples as well. The greater the shift in retention time, the larger the percent error is.
In conclusion, it was shown that HPLC method can be used to determine relative quantities of Vitamin C, but it is not an accurate method for determining the absolute quantities in samples containing other organic acids. In this study, the amount of ascorbic acid in orange juice is determined using HPLC without separating ascorbic acid from the other organic acids present. The experiment was able to rank containers with respect to vitamin C, the fresh sample have the largest concentration, followed by the frozen sample, the carton sample, and the plastic sample. the hypothesis was not correct. One cannot measure how much ascorbic acid oxidizes in different containers because HPLC measures both ascorbic and dehydroascorbic acids. For one to quantify only ascorbic acid content within a sample, voltammetry and titration are two good methods to use. Furthermore, voltammetry could be used because that method allows the determination of one chemical compound within a mixture. Therefore, it cannot be used to concurrently evaluate ascorbic and dehydroascorbic acids (Lagier and Verdini, 2000).
From the previous data, it can be seen that a serving of any of these kinds of commercially available orange juices can fulfill the recommended intake of vitamin C. To intake the largest amount, a person should drink freshly squeezed orange juice. Large intakes of ascorbic acid are important for the human body. In conclusion, high performance liquid chromatography (HPLC) did not provide an adequate instrument for the quantification of vitamin C content in commercially available sources of orange juice. However, one could use HPLC if they separated the acids prior to testing.
Boostani, M. F.; Hamidi, Z. E.; Sahari, M. A. Effect of low temperature on the ascorbic acid content and quality characteristics of frozen strawberry Food Chem., 2004, 86, 357-363.
Collins, C. H.; Silva, C. R.; Simoni, J. A.; Volpe, P. L. O. Ascorbic acid as a Standard for Iodometric Titrations J. Chem. Educ., 1999, 76, 1421-1422.
Gritsanapun, W.; Nilkamhank, S.; Paochom, A.; Suntornsuk, L. Quantitation of vitamin C content in herbal juice using direct titration J. Pharm. Biomed. Anal., 2002, 28, 849-855.
Kabasakalis, V; Moshatou, E.; Siopidou, D. Ascorbic acid content of commercial fruit juices and its rate of loss upon storage Food Chem., 2000, 70, 325-328.
Lagier, C. M.; Verdini, R. A. Voltammetric Iodometric Titration of Ascorbic Acid with Dead-Stop End-Point Detection in Fresh Vegetables and Fruit Samples J. Agric. Food Chem., 2000, 48, 2812-2817.
Paim, A. P.; Reis, B. F. An Automatic Spectrophotometric Titration Procedure for Ascorbic Acid Determination in Fruit Juices and Soft Drinks Based on Volumetric Fraction Variation Anal. Sci., 2000, 16, 487-491.
©