Qualitative Analysis of Gamma-Butyrolactone and Gamma-Hydroxybutyric Acid:
A New Challenge for Forensic Science
Travis Shemwell
Abstract:
The use of GHB/GBL to tamper drinks and perform unlawful acts is an increasing problem in today�s society. In alleged �date rape� cases, it is the job of a forensic scientist to determine if foul play has occurred. Forensic scientists must tackle many challenges in order to obtain the truth. One example of this challenge is the fact that GBL naturally occurs in wine. Once ingested, GBL readily converts to GHB, causing many side effects. This report tackles the question, �Do products such as wine create a false positive in forensic testing?� Using the ultra-violet spectrophotometer, a standard curve was created using the standard concentrations of GBL. This standard curve was used to determine the concentrations of GBL in four different kinds of wines after extraction. The results confirmed significant levels of GBL in wine, suggesting that an analysis of human consumption of alcohol needs to be more thoroughly explored in order to completely rule out the possibility of wine creating a false positive test when evaluating alleged date rape cases.
Introduction:
The name GHB, gamma-hydroxybutyrate, brings to mind the compound used in �date rape� cases. In fact, it is the cause of many of these unfortunate events; however, it can be used for alternative purposes as well. GHB has been around since the 1960�s, when it was used as an anesthetic. Since then, it has been used for treating insomnia, alcoholism, cerebrovascular disorders (Kintz, 2003), and narcolepsy (Ciolino et al., 2001). Unfortunately, the drug had been so badly abused that in 2000, the United States government had to label GHB as a DEA, Drug Enforcement Administration, Control I substance (Hennessy, 2004).
This drug is most often used by rapists in clubs and bars. It is often found that women have their alcoholic drink spiked by GHB. Once women have been drugged, they usually report symptoms such as drowsiness, confusion, dizziness, impaired memory, impaired motor skills, and a paralysis-like state. It also promotes the hormones in the body that aid in arousal (Schwartz, 2000). Bodybuilders also abuse GHB as a hormone booster. However, the effects of GHB for the purpose of bodybuilding are highly debated (Chappell, 2004).
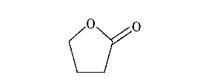
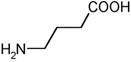
A compound which is closely related to GHB is GBL, Gamma-Butyrolactone. GBL is a lactone of GHB, which is a hydroxylated short chain carboxylic acid. GBL is converted to GHB by hydrolysis, and the reverse reaction is caused by intramolecular esterification (Ciolino et al., 2001).
GBL GHB
GHB is naturally occurring in the body and closely resembles the neurotransmitter gamma-aminobutyric acid (GABA). In mammalian bodies, GABA is converted into GHB. GHB is also formed naturally in the body with the ingestion of GBL. The structures of GHB, GBL, and GAMA are shown in Chart I.
Chart I:
Structures of GHB, GBL, and GAMA
|
GHB |
GBL |
GAMA |
|
|
|
|
GBL is listed only as a List I chemical in the United States. This presents a problem because GBL is present in many commercial products causing the misuse of these products (Ciolino et al., 2001). GBL also naturally occurs in wine, in which it is produced during the fermentation process (Vose, 2001). Taking these factors into consideration, a number of tests have been developed to test for GBL/GHB ratio. Since forensic scientists must consider this ratio before evaluating a rape case or any other criminal case related to GHB.
Factors that affect the rate of conversion of GBL to GHB are the pH level, time, and temperature. According to the work of Ciolino et al., 2001, at acidic pH�s around 2.0, a 2:1 equilibrium ratio of GBL:GHB occurs over a period of nine days (analyzed by HPLC/MS). At basic pH levels, especially around 12.0, an almost complete conversion of GBL to GHB happens within minutes. At the pH levels of 4.0 to 7.0, the conversion process takes several months. Also, at high temperatures, the reaction is significantly faster compared to that at low temperatures (Ciolino et al., 2001).
Forensic science has made significant advancements in the area of alleged date rape cases, including the effects of pH level, time, and temperature on the conversion rate of GBL to GHB. However, there are still unanswered questions within different fields of investigation on this subject. This study is an attempt to answer some of these questions.
An earlier study showed that the analysis of grape juice does not indicate the presence of GBL (Vose, 2001). Wine, which is composed entirely of grape juice and alcohol, has also been analyzed to determine its GBL content and analysis confirms that GBL is present in wine. This indicates that GBL is produced during the fermentation process used to make wine (Vose, 2001). During the fermentation of wine, sugar is converted to alcohol using yeast. This reaction yields ethanol, with GBL and carbon dioxide as by-products (Ough, 1987). Many different kinds of wines contain GBL, which once ingested, converts to GHB. Testing wine samples using a color indicator test and IR spectroscopy determines the presence of GBL in certain wines (Chappell, 2004). GBL gives a unique IR spectrum that is easy to determine and analyze (Chappell, 2004):
Chart I:
IR spectrum of GBL

Chart II:
Analysis of GBL IR spectrum
|
Vibrational Mode |
Wavenumber(cm-1) |
Strength of Peak |
|
Carbonyl stretching mode |
1770 |
Very strong |
|
OH bond stretching |
3525 |
Relatively weak |
|
C-H bond |
2992 |
Relatively weak |
|
In plane deformation of the carboxyl hydrogen and stretching of the carbon oxygen bond in the carboxyl group |
1450-1150 |
Strong |
|
Stretching C-O bond of the terminal hydroxyl group |
1038 |
Strong |
(Harvey, 2000)
The color indicator test (Morris) is another qualitative test that indicates the presence of GBL within the sample. If GBL is present in the sample, formation of a purple color appears. The higher the GBL content in the sample, the darker the purple color. This is a quick and efficient testing method for GBL that many forensic scientists employ, but it is not a quantitative method.
In this study, a quantitative analysis technique using ultra-violet spectrophotometer is used in order to determine the concentration of GBL in several different kinds of wine. The π to π* electron transition of the carbonyl (C=O) functional group in GBL absorbs in the ultra-violet region, which can be used for quantitative testing. Results of this study prove that wine contains enough GBL to actively affect a forensic science drug test. Since GBL and GHB are so closely related, it is important to determine their ratio in the equilibrium mixture at different pH levels. At a pH of 12, the hydrolysis of GBL to GHB is a complete conversion within fifteen minutes (Ciolino et al.., 2001). Between a pH of 12 and a pH of 3, the equilibrium takes several months and the equilibrium concentration of GBL increases as pH decreases. However, at a pH of 2, the equilibrium reaction takes nine days to reach 68% GBL and 32% GHB in the mixture (Ciolino et al., 2001). The average soda has a pH of 2.8 and most drinks tainted with GBL are alcoholic soda drinks. Therefore, the GBL-GHB equilibrium study is conducted at a pH of 2 using a phosphate buffer. The absorbance is recorded initially every hour for six hours and then every day for nine days at the wavelength of maximum absorption, since the equilibrium reaction is logarithmic and will occur more rapidly in the beginning hours than over the total nine-day equilibrium process.
Materials and equipment:
I: Materials:
GBL-(Sigma Aldrich)
California white (local grocery)
California red (local grocery)
Italian white (local grocery)
Germany white (local grocery)
All the other chemicals used were of reagent grade
II: Equipment:
Ultra-violet spectrophotometer (SP 2000)
Infra-red spectrophotometer (Buck Scientific)
Experimental procedure and data:
I. Characterization of GBL:
California white wine sample was qualitatively tested using a Buck Scientific Infrared Spectrophotometer (model 500).
Chart III:
IR Spectrum of wine sample
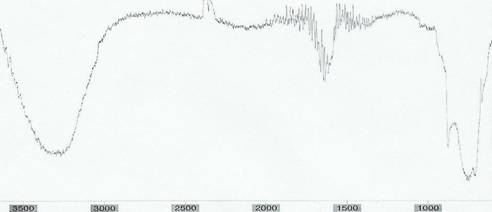
* wavenumbers are in cm-1
The IR spectrum in Chart III allows identification of certain compounds within wine. The broad peak from 3600 � 3000 cm-1 is due to the alcohol in the wine. The smaller, semi-wide peak just below 1800 due to the carbonyl stretching represents the key identifier of GBL. However, the IR spectroscopy cannot conclude any quantitative data useful for determining concentration of GBL in wine. Other attempts utilizing the visible absorbance spectrophotometer also concluded that the color indicator test was a useful qualitative analysis technique; however, it could not be used for quantitative analysis.
II. Standardization of GBL using UV Absorption:
1 x 10⁻³ M standard GBL solution was scanned from 200nm to 300nm in order to find the optimum wavelength of absorbance for testing.
Graph I:
Determination of wavelength of maximum absorption
The optimum absorbance was found at 205nm. A standard curve is obtained using standard solutions of GBL at a range of concentrations (1x10⁻³M to 1x10⁻⁴M) and measuring their absorbance at the wavelength of maximum absorption.
Chart IV:
Absorbance of standard solutions
1 x 10⁻³ to 1 x 10⁻⁴ M GBL at 205 nm
|
Concentration (M) |
Absorbance |
|
1.00x10⁻³ |
0.551 |
|
9.00x10⁻⁴ |
0.500 |
|
8.00x10⁻⁴ |
0.436 |
|
7.00x10⁻⁴ |
0.385 |
|
6.00x10⁻⁴ |
0.320 |
|
5.00x10⁻⁴ |
0.277 |
|
4.00x10⁻⁴ |
0.230 |
|
3.00x10⁻⁴ |
0.231 |
|
2.00x10⁻⁴ |
0.178 |
|
1.00x10⁻⁴ |
0.099 |
Graph II:
Standard curve
1x10⁻³ M to 1x10⁻⁴ M GBL at 205 nm
III. Quantification of GBL in wine samples using UV absorption:
Once a standard curve is established, the concentration of GBL in wine was determined. The wine samples are prepared using chloroform to extract GBL from wine by mixing 10�l of wine sample with 10�l of chloroform in a separator funnel. Then GBL is extracted to a water phase from chloroform using multiple extractions. GBL in aqueous phase is used for absorption measurements.
Each sample tested, however, needed to be diluted differently depending upon amount of GBL in solution. The samples of wine tested were from Italy, Germany, California (white), and California (red).
Chart V:
Wine samples
|
Wine |
Dilution ratio |
Absorbance 1 |
Absorbance 2 |
Average absorbance |
|
California (red) |
1:40 |
0.841 |
0.789 |
0.815 |
|
California (white) |
1:20 |
0.874 |
0.801 |
0.838 |
|
Germany |
1:30 |
0.636 |
0.677 |
0.657 |
|
Italy |
1:20 |
0.465 |
0.477 |
0.471 |
IV. Kinetics of GBL to GHB conversion:
The rate of conversion of GBL to GHB is measured at a pH of 2. Using a phosphoric acid buffer, a nine-day kinetics study was conducted.
Chart VI:
Absorbances in time (first six hours) at pH 2
at three different GBL concentrations
|
time (hr) |
1.00x10⁻⁴ M |
5.00x10⁻⁴ M |
1.00x10⁻³ M |
|
0 |
0.048 |
0.247 |
0.519 |
|
1 |
0.046 |
0.241 |
0.501 |
|
2 |
0.045 |
0.239 |
0.481 |
|
3 |
0.042 |
0.234 |
0.469 |
|
4 |
0.041 |
0.225 |
0.451 |
|
5 |
0.040 |
0.211 |
0.437 |
|
6 |
0.039 |
0.201 |
0.423 |
Graph III:
Absorbances vs. time (first six hours) at pH 2
at three different GBL concentrations
Chart VII:
Absorbances vs. time (nine days) at pH 2
at three different GBL concentrations
|
Time (days) |
1.00x10⁻⁴ M |
5.00x10⁻⁴ M |
1.00x10⁻³ M |
|
2 |
0.039 |
0.199 |
0.419 |
|
3 |
0.037 |
0.193 |
0.410 |
|
4 |
0.037 |
0.186 |
0.389 |
|
5 |
0.036 |
0.177 |
0.377 |
|
6 |
0.035 |
0.175 |
0.362 |
|
7 |
0.035 |
0.173 |
0.351 |
|
8 |
0.034 |
0.171 |
0.349 |
|
9 |
0.034 |
0.172 |
0.348 |
Graph IV:
Absorbances vs. time (nine days) at pH 2
at three different GBL concentrations
Data analysis and results:
I. GBL concentrations in wine samples:
Using the standard curve equation and relative absorbance depending upon dilution, the concentration of GBL in wine was experimentally determined.
Chart VIII:
Experimentally determined GBL concentrations in wine samples
|
Wine type |
Absorbance |
Concentration, M (dilution ratio) |
Original concentration, M |
|
California (red) |
0.815 |
1.588x10⁻³(1:40) |
6.352 x 10⁻³ |
|
California (white) |
0.838 |
1.636x10⁻³ (1:20) |
3.272 x 10⁻³ |
|
Germany |
0.657 |
1.255x10⁻³ (1:30) |
3.765 x 10⁻³ |
|
Italy |
0.471 |
0.866x10⁻³ (1:20) |
1.732 x 10⁻³ |
II. Kinetics of GBL to GHB conversion:
The six hour study at a pH of 2 resulted in a first order relation between ln absorbance and time.
Chart IX:
ln absorbance vs. time (six hour study) at pH 2 at three different concentrations
|
time (hr) |
1 x 10⁻⁴ M |
5 x 10⁻⁴ M |
1 x 10⁻³ M |
|
0 |
-3.037 |
-1.398 |
-0.656 |
|
1 |
-3.079 |
-1.423 |
-0.691 |
|
2 |
-3.101 |
-1.431 |
-0.732 |
|
3 |
-3.170 |
-1.452 |
-0.757 |
|
4 |
-3.194 |
-1.492 |
-0.796 |
|
5 |
-3.219 |
-1.556 |
-0.828 |
|
6 |
-3.244 |
-1.604 |
-0.860 |
Graph V:
ln absorbance vs. time (six hour study) at pH 2
at three different concentrations
The rate constant of GBL to GHB conversion reaction can be determined using Graph V since k = - slope.
Chart X:
Rate constants measured at three different concentrations
|
Concentration (M) |
Experimental k value (hr -1) |
|
1.00x10⁻⁴ |
.0340 |
|
5.00x10⁻⁴ |
.0337 |
|
1.00x10⁻³ |
.0344 |
average k = .034433 hr -1
III. Equilibrium amounts of GBL and GHB:
The equilibrium ratio of the mixture is determined by finding the ratio of initial absorbance to the final absorbance.
Chart XI:
Equilibrium ratio of GBL:GHB
|
Concentration |
1.00x10⁻⁴ M |
5.00x10⁻⁴ M |
1.00x10⁻³ M |
|
Absorbance after nine days |
.0340 |
.1720 |
.3480 |
|
Initial absorbance |
.0480 |
.2470 |
.5190 |
|
Ratio of GBL:GHB |
.7083 |
.6964 |
.6705 |
Chart XII:
Equilibrium percent GBL:GHB
|
concentration |
1.00x10⁻⁴ M |
5.00x10⁻⁴ M |
1.00x10⁻³ M |
|
Percent GBL (%) |
70.83 |
69.64 |
67.05 |
|
Percent GHB (%) |
29.17 |
30.36 |
32.95 |
Average Percent GBL = 69.2%
Average percent GHB = 30.8%
Conclusion and Discussion:
The purpose of this study was to determine if wine contains enough GBL to create a �false positive� during a forensic drug test. To answer this question, different analysis techniques were tested to determine the concentration of GBL in wine. IR spectrum was able to verify GBL�s presence in wine; however, it failed to determine the concentration levels. Further investigation of the ultra-violet region led to the detection of the carbonyl group�s pi electron excitation which has a maximum absorption around 205nm. A standard curve using pure standard GBL solutions was established at this wavelength. After testing the wine samples, the standard curve was used to determine the concentration of GBL. The concentrations of GBL in wine samples are as follows:
Chart XIII:
Concentration of GBL in wine
|
Wine |
Concentration (M) |
|
California (red) |
6.352 x 10⁻³ |
|
California (white) |
3.272 x 10⁻³ |
|
Germany (white) |
3.765 x 10⁻³ |
|
Italy (white) |
1.732 x 10⁻³ |
The results show that the California red wine contains the highest concentration of GBL, while the Italian white wine contains the lowest concentration. These results are consistent with those of earlier study (Ciolino et al., 2001) in that red wine has higher levels of GBL than white wine and that the Italian wine contains the lowest concentration of GBL.
These concentrations suggest that enough consumption of wine could affect a forensic drug test. However, the results of this study are not conclusive enough to verify this theory. A further analysis should be conducted involving human consumption to confirm this thesis. The results of this experiment suggest that, it is overwhelmingly possible that the consumption of wine could affect a forensic drug test.
Forensic science deals with GHB/GBL in alleged date rape cases. When a victim makes claims of being raped and/or drugged, the police department�s forensic scientists attempt to find scientific evidence supporting or eliminating the subject�s allegations. Depending on the case, different techniques are employed to find this evidence. The easiest determination of GHB is to analyze the drink that was claimed to be tainted. However, in most cases, the victim is the most reliable object to base judgment upon. Blood, urine, and hair testing can also be used to determine GHB; however, these tests must be conducted in a timely manner due to the fact that GHB only exits in the body for a short time. Another factor to be considered is that GHB naturally occurs within the body. During normal brain metabolism, GABA (gamma-aminobutyric acid) is converted to GHB (Vose, 2001). The natural amounts of GHB within the body are below a forensic drug testing threshold. However, when outside or artificial sources of GHB (such as wine) ingested additionally, the level of GHB maybe increased to levels above the forensic testing threshold.
This thesis and the reasons stated above call for another study to be conducted to account for GHB naturally occurring in the body as well as the GHB amount due to the ingestion of products containing GBL (i.e. wine). The threshold of the color indicator test is 3.00x10⁻³ M, which is fairly close to the GBL concentrations found in wine. All forensic tests using blood, urine, and hair have a threshold limit relatively close to the concentration of GBL in wine. Therefore, a further study testing subjects before and after ingesting wine to determine if GHB levels rise to create a �false positive� would be more conclusive. If consumption of wine affects the GHB test, then forensic scientists must develop a new test to eliminate the interferent�s affect within the testing procedure.
The forensics lab, when dealing with alleged rape cases, focuses its investigation towards tainted drinks. Since GHB is a Control I substance, GBL is much easier to obtain and often replaces GHB due to the conversion between the two. Most drinks tainted by GBL are mixed drinks that contain alcohol and dark soda (however, anything can be tainted due to the colorless and almost odorless character of GBL). The average soda has a pH of 2.8. Therefore, the study of equilibrium ratio was conducted at a pH of 2. According to Chappell, at a pH of 2, the hydrolysis of GBL to GHB is a nine day process and equilibrates to 68%GBL/32%GHB. The percent equilibrium found in this study was 69.2% and 30.8%, respectively. The agreement between the earlier study and our data is within 2.7%. This close agreement concludes that this experiment using the ultra-violet spectrophotometer was highly accurate and precise compared to previous studies done with HPLC/MS. The rate constant of GBL to GHB conversion is found to be .034433/hr. This rate constant is an extremely useful quantitative characteristic of the chemical conversion between GBL and GHB. All data obtained in this study is in agreement with previous studies done; however, this is the first known study using the ultra-violet spectrophotometer.
References:
Bravol, Dawn T., David O. Harris, Stanley M. Parsons, Reliable, Sensitive, Rapid and Quantitative Enzyme-Based Assay for Gamma-Hydroxybutyric Acid (GHB), J Forensic Sci, Mar. 2004, Vol. 49, No. 2
Chappell, John S., Ashleigh W. Meyn, Kenley K. Ngim, The Extraction and Infrared Identification of Gamma-Hydroxybutyric Acid (GHB) from Aqueous Solutions. J Forensic Sci, Jan. 2004, Vol. 49, No. 1
Ciolino, Mesmer, Satzger, Machal, McCauley, Mohrhaus. The chemical interconversion of GHB and GBL: forensic issues and implications. J Forensic Sci 2001, 46(6):1315�1323.
Harvey, David. Modern Analytical Chemistry. Boston: Mcgraw-hill, 2000.
Hennessy, Sinead A., Moane, Siobhan M., McDermott, Sean D. The reactivity of gamma-hydroxybutyric acid (GHB) and gamma-butyrolactone (GBL) in alcoholic solutions. [Journal Article] Journal of Forensic Sciences. 49(6):1220-9, 2004 Nov.
Kintz, Pascal ,Vincent Cirimele, Carole Jamey, Bertrand Ludes. Testing for GHB in Hair by GC/MS/MS after a Single Exposure. Application to Document Sexual Assault. J Forensic Sci, Jan. 2003, Vol. 48, No. 1.
Mermelstein, Neil H. Removing Alcohol from Wine. Food technology, vol. 54, no. 11, November 2000.
Morris, Jeremiah. Application of the Hydroxamic Acid Test for Presumptive GBL Detection. Johnson County Sheriff�s office.
Ough, Cornelius S., Chemicals used in making wine, C&EN, January 5, 1987.
Rush, Bristol, Krystal Bagley, Deanne Grant, Emil Bobyock, Anthony Macherone and G. John DiGregorio, The stability of Gamma Hydroxybutyric Acid and Gamma Butyrolactone in Wine and Vodka. http://www.frfoundation.org/rrr23200.htm, fall 2000.
Schwartz, Richard H., Regina Milteer, Marc A. LeBeau, Drug-facilitated Sexual Assault �Date Rape�, June 2000, Southern Medical Journal, Vol. 93, No.6.
Smith, Pamela R., Joseph S. Bozenko, Jr., New presumptive Tests for GHB, U.S. Department of Justice/Drug Enforcement Admisistration.
Vose J, Tighe T, Schwartz M, Buel E. Detection of gamma-butyrolactone (GBL) as a natural component in wine. J Forensic Sci 2001, 46(5):1164�1167.
Wesley, James F. Osmolality-A Novel and Sensitive Tool for Detection of Tampering of Beverages Adulterated with Ethanol, γ-Butyrolactone, and 1,4-Butanediol, and for Detection of Dilution-Tampered Demerol Syringes. Microgram Journal, Volume 1, Numbers 1-2(January-June 2003).
©